We are excited to introduce a new industry-first feature that enhances transaction analysis by allowing users to view their buy/sell transactions directly on charts . This feature helps users identify market trends based on their past trades, offering a more intuitive approach compared to traditional tabular transaction records.
Feature Highlights:
- Track Buy and Sell Transactions : Users can see their buy and sell transactions along with the quantity traded.
- Supports Both Cash and Derivatives: Users can visualize transactions for both cash market trades and derivatives trades.
- Past Trades Display : Only past trades will be shown on the charts to help users analyze their historical transactions.
How This Feature Helps Traders
By analyzing past transactions on the chart, traders and investors can gain valuable insights, such as:
- Did you buy the stock at its peak? – Identify if the purchase was made at a high price, leading to potential losses.
- Did you buy the stock when it was undervalued? – Determine if the stock was acquired at a low price before an upward trend.
- Did you miss potential gains due to an early sell? – Analyze whether selling too soon resulted in lost profit opportunities.
Explore the Feature
Users can experience this feature on our trading platform: https://tv.5paisa.com/

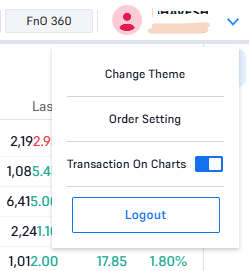
How to Enable
This feature can be viewed by enabling ‘Transaction on Chart’ in the Profile section.
We encourage traders and investors to explore this feature and share their feedback to further enhance the trading experience.